- What a Pump Curve Really Tells You (and What It Doesn’t)
- The System Curve: Where Pontoon Dredging Becomes Real
- Why Dredging Performance Never Matches Clear-Water Curves
- NPSH on Pontoon Dredges: The Quiet Performance Killer
- Pipeline and Hose Losses: Why Your Operating Point Keeps Shifting
- Wear and Erosion: How Pump Curves Drift Over Time
- Using Pump Curves to Size and Run a Pontoon Dredge Correctly
- Turning Pump Curves Into Predictable Dredging Performance
On paper, everything looks right. The pump is sized correctly. The engine has enough power. The pontoon dredge should deliver the required flow. But once operations start, reality hits. Production stays low. Wear parts disappear faster than expected. Fuel consumption climbs with no clear explanation.
In most cases, the problem isn’t the pump. It’s how the pump curve is being read and applied in real pontoon dredging conditions.
Pump curves don’t fail you. Misreading them does.
Clear-water curves rarely reflect what happens when you introduce solids, flexible hoses, changing elevations, and compact pontoon layouts. If you rely on brochure values alone, dredging performance will almost always fall short.
This article explains how pump curves actually apply to pontoon dredging, why field performance differs from test data, and how you can use curves to make better sizing and operating decisions. If you size, operate, or troubleshoot dredges, this is the gap you need to close.
What a Pump Curve Really Tells You (and What It Doesn’t)
A pump curve sets expectations, but it doesn’t promise results. It shows what a pump can deliver under specific test conditions, not what your dredge will produce once it’s floating, loaded with solids, and tied into a real pipeline. When pump curves get treated as production guarantees, disappointment usually follows.
At its core, a pump curve describes hydraulic capability. It shows how the pump behaves as flow changes, how much head it can generate, and how efficiently it converts power into movement. It does not account for how you install the pump, how the dredge operates, or what the material looks like once it enters the system.
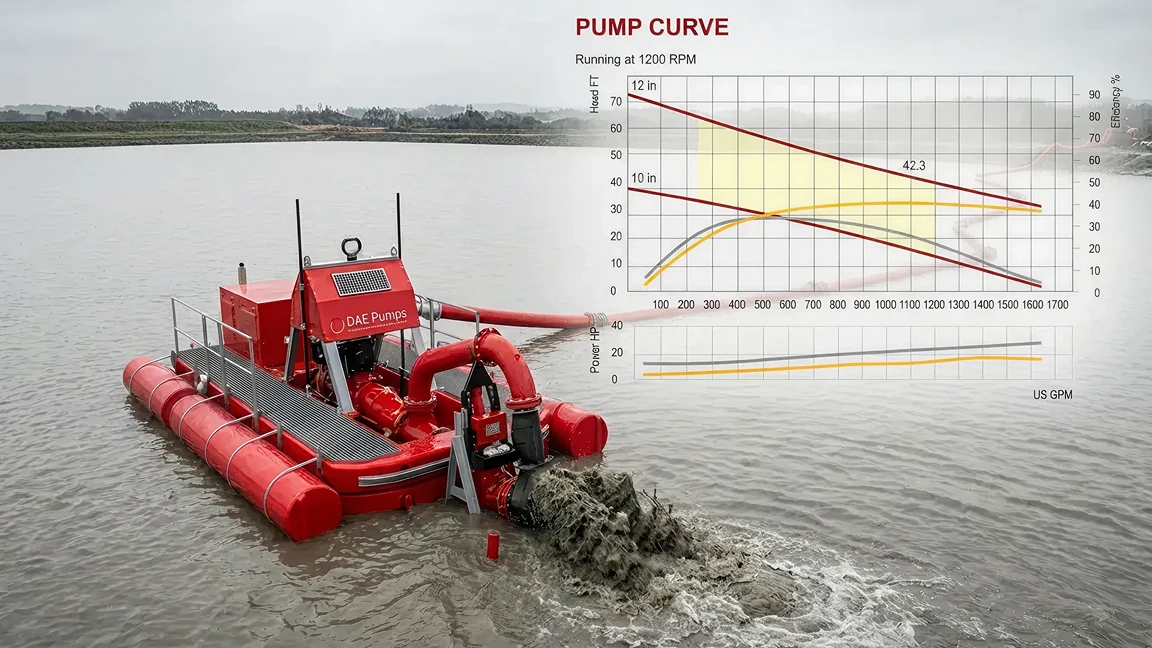
Every pump curve includes a few core elements you should recognize immediately:
- Flow versus head, which defines the basic operating range
- Efficiency Bands and the Best Efficiency Point
- Power demand increases or decreases as the flow increases or decreases
- Net Positive Suction Head required
- Speed lines and impeller trims that show how performance shifts
What matters just as much is what the curve leaves out. These curves are developed under controlled test conditions. They assume clean water, steady suction, and a fixed layout. They don’t see your pontoon geometry, hose routing, ladder depth, or discharge setup. They don’t adjust for slurry density, wear, or changing site conditions.
That’s why treating a pump curve in isolation leads to poor dredging performance. A pump curve is only half the story. The system finishes it.

The System Curve: Where Pontoon Dredging Becomes Real
A pump curve tells you what the pump can do. A system curve tells you what your pontoon dredge demands from that pump at different flow rates. Put simply, the system curve is the “cost” of moving slurry through your setup. As flow increases, the system usually asks for more head. When the flow drops, the demand falls. The pump can only run where its curve meets that demand.
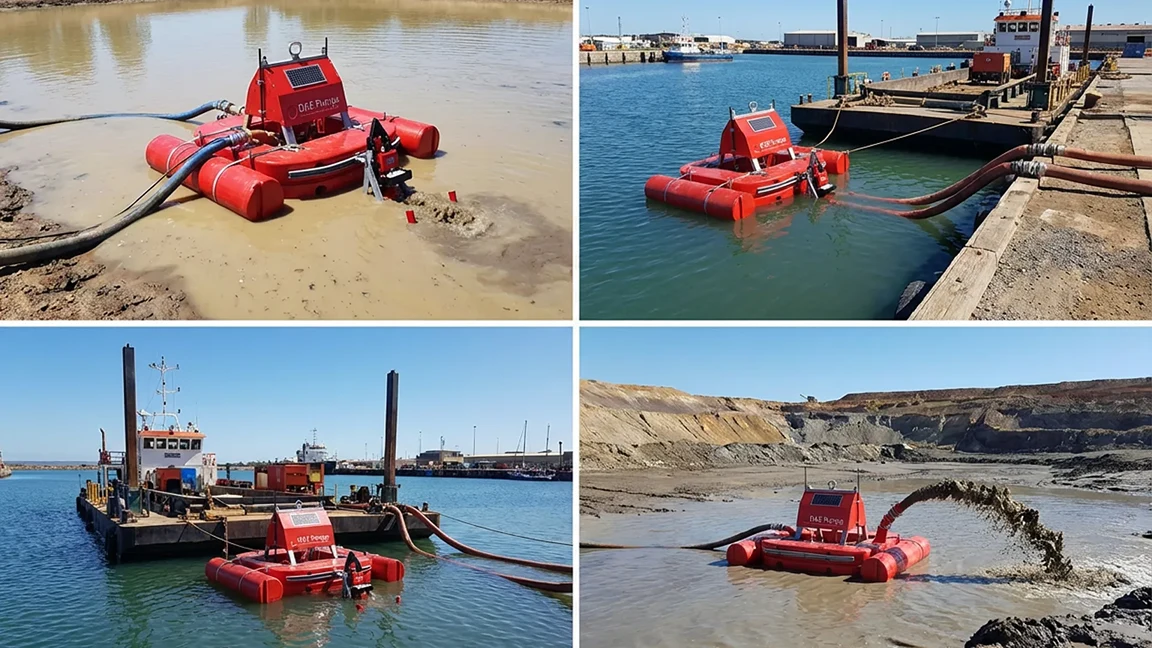
On a pontoon dredge, that demand is rarely stable. Your layout is compact, the hoses are flexible, and operating conditions change throughout the day. That’s why the same pump can look strong during setup and then feel “weak” once dredging starts.
What actually builds your system curve on a pontoon dredge:
- Static head: The elevation difference created by ladder depth, water level, and discharge point height
- Friction losses: Resistance through suction and discharge hoses, pipeline length, and internal roughness
- Minor losses: Extra head loss from elbows, swivels, valves, reducers, manifolds, and tight pontoon routing
- Operating margin: Allowance for wear, slurry density swings, and real-world variability
And the system curve doesn’t stay put. It shifts during operations because hose routing changes, ladder depth varies as you chase material, and discharge conditions move with tide, distance, or placement requirements.
That’s the key point: your pump doesn’t “operate on its curve.” It operates where the pump curve and system curve intersect, not where the brochure says it should.
Why Dredging Performance Never Matches Clear-Water Curves
Pump curves are almost always based on clean water. Pontoon dredging never is. The moment solids enter the flow, the pump stops behaving the way the test curve suggests it should. That mismatch is the root cause of most performance gaps seen in the field.
When a dredge pump moves slurry instead of water, several things happen at once. The pump generates less head at the same flow rate because the mixture resists movement more than water. Efficiency drops because energy is lost to particle interaction, turbulence, and internal slip. At the same time, power demand increases because the pump is moving a heavier mixture through higher losses. The curve hasn’t changed on paper, but real dredging performance has shifted away from it.
That’s why experienced engineers never apply clear-water curves directly to pontoon dredging. Instead, they treat those curves as a starting point and adjust them to reflect what the pump will actually see.
In practice, the process is straightforward:
- Start with the clear-water pump curve
- Estimate slurry density and solids concentration
- Apply slurry derating or correction factors
- Recheck power demand and operating range
Problems usually appear when operators chase extreme flow points to “make up” lost production. Running far left or far right of the curve increases wear, raises vibration, and often makes output less stable, not more.
In pontoon dredging, staying near the Best Efficiency Point band protects both production and equipment. It’s the most reliable way to balance output, wear life, and operating cost.

NPSH on Pontoon Dredges: The Quiet Performance Killer
Most dredging cavitation problems start on the suction side. They don’t announce themselves clearly, and by the time damage is obvious, performance has already dropped.
Pontoon dredges are especially vulnerable to NPSH issues because their suction conditions are rarely ideal. Long suction hoses add losses before the pump ever sees the flow. Submergence changes constantly as the ladder depth and water level shift. Air leaks, loose couplings, and vortexing introduce entrained air that reduces effective suction pressure. On paper, everything may look acceptable. In the water, it often isn’t.
Several field conditions directly affect NPSH available during pontoon dredging:
- Ladder depth and water level: Small changes alter suction head more than most operators expect
- Suction hose length and condition: Extra length, soft spots, or partial collapse increase losses
- Strainer cleanliness: Fouling adds restriction and quietly steals NPSH margin
- Air ingress at connections: Even minor leaks disrupt stable flow
When NPSH falls short, the symptoms are rarely subtle. Operators see vibration increase, hear unusual noise, and replace wear parts far sooner than planned. Flow becomes unstable, and production fluctuates without an obvious cause.
The practical rule is simple. If NPSHa barely clears NPSHr on paper, it won’t survive real dredging. Build margin into the suction side, or the pump will take it back through wear and downtime.
Pipeline and Hose Losses: Why Your Operating Point Keeps Shifting
In dredging systems, friction loss is the silent force that keeps moving your operating point. As flow increases, friction rises fast. Losses grow roughly with the square of velocity, which means small increases in flow demand can require a much larger increase in head. On a pump curve, that pushes the operating point left or right faster than most crews expect.
This effect matters more in pontoon dredging because the layouts are tight and rarely simple. Compact pontoons force sharp routing. Multiple bends, swivels, and transitions stack losses on top of each other. Flexible hoses add another variable, since their internal condition and shape change over time and under load. The result is a system curve that steepens quickly as flow rises.
Several common field changes quietly reduce dredging performance:
- Added hose length: Extra distance increases friction even if everything else stays the same
- Extra elbows or swivels: Each fitting adds loss that compounds across the system
- Partially collapsed suction hose: Reduces effective diameter and spikes velocity losses
- Worn or rough internal liners: Higher roughness means higher friction at the same flow
For calculations, engineers typically rely on Darcy-Weisbach because it applies across flow regimes and pipe conditions. Hazen-Williams is often used for water systems, but breaks down when conditions change or when mixtures are involved.
The practical takeaway is simple. Small layout changes can move you far off your intended pump curve, even when the pump itself hasn’t changed.

Wear and Erosion: How Pump Curves Drift Over Time
In abrasive dredging service, pump curves don’t stay fixed. Wear slowly reshapes them. As impellers, liners, and volutes erode, internal clearances grow. That wear reduces the head the pump can generate at the same speed, shifts the efficiency point away from its starting point, and increases internal leakage. The pump is still turning at the same rpm, but it’s doing less useful work.
Operators usually notice the effects before they connect them to wear. Discharge pressure drops even though engine speed hasn’t changed. Production falls off gradually, not suddenly. The dredge feels less responsive, and pushing harder with rpm delivers diminishing returns. Same settings, worse results.
This is where many dredges lose efficiency without anyone realizing why. The pump curve on paper hasn’t changed, but the real curve has drifted.
The fix starts with monitoring. Track suction and discharge pressure alongside rpm under similar operating conditions. Compare trends over time, not just daily output. Pressure and speed tell you when performance is decaying long before production numbers make it obvious.
Using Pump Curves to Size and Run a Pontoon Dredge Correctly
Pump curves become useful only when you apply them with discipline. In pontoon dredging, that means sizing for real operating conditions and running the pump inside a stable, efficient range instead of chasing short-term gains.
A field-ready sizing workflow keeps decisions grounded:
- Define production targets in volume and solids. Start with what you need to move, not just water flow. Production in cubic meters or tons per hour drives everything else.
- Convert targets to a mixture flow. Translate solids throughput into slurry flow using realistic density and concentration values.
- Select a BEP-centered operating range. Choose a flow band near the Best Efficiency Point to balance output, wear, and stability.
- Build best-case and worst-case system curves. Account for short and long hose runs, shallow and deep ladder positions, and discharge elevation changes.
- Overlay curves across speeds and impeller trims. Confirm that acceptable operating points exist without forcing the pump to extremes.
- Verify NPSH margin across the range. Check suction conditions at each operating point, not just at one flow.
- Confirm driver power with wear allowance. Ensure the engine or motor can handle both slurry effects and future wear.
Once the dredge is running, curves remain relevant in daily operations. Crews can use simple checks to keep performance stable:
- Record suction and discharge pressure during steady runs
- Log rpm and ladder depth together
- Check hose routing and obstructions before increasing speed
- Avoid long operations far left or right of the BEP band
- Compare weekly data under similar conditions
Turning Pump Curves Into Predictable Dredging Performance
Pump curves are tools, not promises. They describe capability, not guaranteed output. In pontoon dredging, real performance depends on the full system, including suction conditions, hose routing, slurry properties, and wear over time. Small operational choices, such as changing ladder depth or adding a bend, can shift the operating point enough to affect production, efficiency, and wear. When problems show up, the cause is usually visible on the curve long before it appears in daily output numbers.
When you treat pump curves as living references instead of static charts, production becomes predictable, and problems become easier to diagnose. If you want support applying pump curves to real pontoon dredging conditions, visit daepumps.com to explore dredge pump solutions, technical guidance, and application expertise built around field performance, not brochure assumptions.